It’s clear that a fair amount of subjective input and interpretation of available data is needed to accurately evaluate fielding performance. With this in mind, John Dewan, owner of Baseball Info Solutions (BIS) and long time leader in the sabermetric community, developed an interesting approach to the evaluation of fielding performance eight years ago. Rather than relying solely on statistics, he put together a “panel of experts” to select the best fielders at each position. He calls it the Fielding Bible Awards and he includes them in the Bill James Handbook.
The way the Fielding Bible Awards work is each of 12 voters ranks 10 players at each position. A player gets 10 points for a first place vote, 9 points for a second place vote, etc. Among the voters were several prominent sabermetricians including Dewan, Bill James and Rob Neyer, BIS video scouts who studied every single game of the 2014 season in great detail, former major league outfielder Doug Glanville and knowledgable fans who participated in the Tom Tango Fan Scouting Report.
In contrast to the Fielding Bible awards, the Gold Gloves have historically been selected by managers and coaches. Managers and coaches still vote, but a statistical component was added in 2013. So, it is interesting to see how the two awards compare. Of the 18 positions, nine in each league, the Fielding Bible matched the Gold Glove in 12 cases (which is the same match rate as last year). There were four mismatches in the AL and two in the NL.
Just like last year, the biggest disagreement in the American League was in center field were Orioles fly catcher Adam Jones won a Gold Glove, but finished 7th in the AL in the Fielding Bible vote. He finished around average on both Total Zone (-3) and Defensive Runs Saved (+2) which explains why he did not do especially well on the more statistically oriented Fielding Bible Award. First place finisher in the AL on the Fielding Bible vote was Jackie Bradley of the Red Sox finished +10 and +14 on the metrics.
Just like last year, the biggest disagreement in the American League was in center field were Orioles fly catcher Adam Jones won a Gold Glove, but finished 7th in the AL in the Fielding Bible vote. He finished around average on both Total Zone (-3) and Defensive Runs Saved (+2) which explains why he did not do especially well on the more statistically oriented Fielding Bible Award. First place finisher in the AL on the Fielding Bible vote was Jackie Bradley of the Red Sox finished +10 and +14 on the metrics.
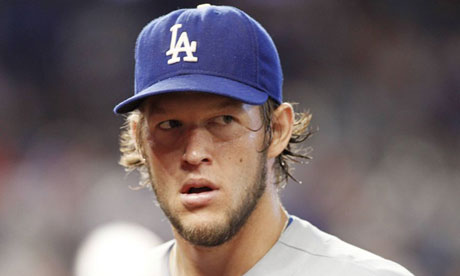
There were no big discrepancies the National League. Cardinals catcher Yadier Molina won the Gold Glove for the seventh consecutive year while finishing third in the Fielding Bible voting behind Jonathan LuCroy of the Brewers and Russell Martin of the Pirates. Additionally, Dodgers pitcher Zack Greinke won the Cy Young as Clayton Kershaw finished first in the Fielding Bible tally. Greinke also did well on the Fielding Bible with the third most points in the NL.
So, are the Fielding Bible Awards better than the Gold Glove? I like them because I believe they are less biased by reputation. However, I do value the input of managers and coaches in the Gold Glove voting and they are trying to work some statistics into the process. At the very least, the Fielding Bible is a nice complement to the available quantitative data and an interesting alternative to the Gold Glove Awards. I believe they are a significant contribution to the ongoing quest to more accurately assess fielding performance.
Table 1: Fielding Bibles Versus Gold Glove Awards, 2014
Fielding
Bible
|
Gold
Glove
|
|||
Position
|
AL
|
NL
|
AL
|
NL
|
Catcher
|
Salvador
Perez
|
Jonathan
Lucroy
|
Salvador
Perez
|
Yadier
Molina
|
First base
|
Albert
Pujols
|
Adrian
Gonzalez
|
Eric
Hosmer
|
Adrian
Gonzalez
|
Second base
|
Dustin
Pedroia
|
DJ LeMahieu
|
Dustin
Pedroia
|
DJ LeMahieu
|
Shortstop
|
J.J. Hardy
|
Andrelton
Simmons
|
J.J. Hardy
|
Andrelton
Simmons
|
Third base
|
Josh
Donaldson
|
Nolan
Arenado
|
Kyle Seager
|
Nolan
Arenado
|
Left field
|
Alex Gordon
|
Christian
Yelich
|
Alex Gordon
|
Christian
Yelich
|
Center field
|
Jackie Bradley
|
Juan Legares
|
Adam
Jones
|
Juan Legares
|
Right field
|
Kevin
Kiermaier
|
Jason
Heyward
|
Nick
Markakis
|
Jason
Heyward
|
Pitcher
|
Dallas
Keuchel
|
Clayton
Kershaw
|
Dallas
Keuchel
|
Zack
Greinke
|