Sunday, November 29, 2015

Tigers Agree To Deal With Jordan Zimmermann

Right hander Jordan Zimmermann Bolsters Tigers Rotation for 2016 and beyond.  
(Photo Credit: Cathy T via HardballTimes)

Tigers General Manager Al Avila promised that the Tigers would sign a top three pitcher to go with Justin Verlander and Anibal Sanchez and today he got his man.  According to Jon Heyman of CBS Sports, the Tigers have agreed to a contract with right hander Jordan Zimmermann, formerly of the Nationals.  Jon Morosi of Fox Sports is reporting that the deal will be for an estimated 5 years/ $110 million.

Since 2011, the 29-year-old Zimmermann has compiled an impressive 3.14 ERA and 3.30 FIP and has  ranked 12th in MLB in the FanGraphs.com WAR statistic.  Despite undergoing Tommy John surgery in 2009, he has become a durable starter throwing 195+ innings in each of the last four years.

On the downside, Zimmermann had an off year - for him - in 2015 posting a 3.66 ERA, 3.75 FIP and allowing a career high 24 home runs.  Statistics at BrooksBaseball.com indicate that his fastball velocity averaged 93.4 MPH, down about a mile per hour from his career norm.  That is not be a big deal in itself especially for a pitcher who has not relied on a high strikeout rate (just 7.3 per nine innings for his career).  However, he allowed a .301 batting average against and .465 slugging average against on fastballs, the highest marks of his career.

So, one might wonder whether the ineffectiveness of his fastball is a one year thing or whether it will become a trend.  The good news is that his slider and curve still yielded good results and his overall numbers were above average.

Even with the caveats, Zimmermann was the fourth best starting pitcher in a deep free agent market behind David Price, Zack Greinke and Johnny Cueto.  Assuming the Tigers were not going to get one of the big three, there is no pitcher that comes without significant risk.  Jeff Samardzija was awful last year and lost more off his fastball than Zimmerman.  Hisahi Iwakuma has health concerns.  Scott Kazmir has never been stable nor durable.  The list goes on.

In the end, I have to conclude that a five-year deal for a pitcher of Zimmermann's caliber is not bad. This gives the Tigers a pretty solid trio of Verlander, Zimmermann and Sanchez at the top of their rotation along with a very promising Daniel Norris at number four.

Avila has been true to his plan thus far adding a closer, outfielder (even if he wasn't the most popular choice among fans) and now a top starter.  Zimmermann will most likely be Detroit's biggest off-season acquisition, but there is still work to be done.  Avila also promised a fifth starter and at least one more reliever, so we can expect more moves soon.

Friday, November 20, 2015

Maybin Still Has Range In The Outfield

Outfielder Cameron Maybin should bolster the Tigers outfield defense.
(Photo source: Wikimedia.com)

Today's acquisition of outfielder Cameron Maybin for left-handed pitchers Ian Krol and Gabe Speier brought mixed reviews from Tigers fans today.  On one hand, it appears the Tigers did not give up much and Maybin is guaranteed only $6 million over the next two years making it a low risk move.  On the other hand, he has a career OPS of just .678, so his value revolves around his speed and defense.  

There is not much question about his base running.  He stole 23 bases in 29 attempts and netted 3.5 runs on the bases in 2015 according to the Baseball Prospectus base running statistic.  

There are, however, concerns about his defense due to his performance on the two most popular advanced defensive metrics: -16 Defensive Runs Saved (DRS) and -7 Ultimate Zone Rating (UZR) This is in contrast to past years where he graded average to above average.  

In addition to being careful about interpreting one year of defensive data, it's important to remember that below average numbers in center field do not make one a poor defender.  In an era of highly skilled center field play, it just means that he was not as good as some great defenders.

There are indications that he still has some defensive skills.  Atlanta Braves fans gave him a rating of 52 on Tom Tango's Fan Scouting Report which is slightly better than the 48 ranking given by Tigers fans to Rajai Davis, the man Maybin is presumably replacing on the roster.  

What is more interesting is how fans broke down Maybin's skills.  They ranked him above average on instincts, acceleraton/first few steps and sprint speed, but below average on release/footwork and throwing strength and accuracy.  So, it appears he had good range but not a good arm.  

Another set of statistics that I presented last week - Revised Zone Rating Numbers - backs up the fans observations of above average range. While Maybin made 13 fewer plays than expected by an average center fielder inside the zone, he also made 13 more plays outside the zone than expected.

So, Maybin can still cover a lot of ground in the outfield and he will likely spend more time in left than center for the Tigers as the roster is currently constructed.  With this less elite comparison group, there is a good chance his numbers will show him to be a plus defender for the Tigers.   

Saturday, November 14, 2015

Fielding Bible Versus Gold Glove Awards - 2015

Tigers second baseman Ian Kinsler won the Fielding Bible voting, but not the Gold Glove Award
(Photo credit: NBCHardBallTalk.com)


It’s clear that a fair amount of subjective input and interpretation of available data is needed to accurately evaluate fielding performance. With this in mind, John Dewan, owner of Baseball Info Solutions (BIS) and long time leader in the sabermetric community, developed an interesting approach to the evaluation of fielding performance eight years ago.  Rather than relying solely on statistics, he put together a “panel of experts” to select the best fielders at each position. He calls it the Fielding Bible Awards and he includes them in the Bill James Handbook.

The way the Fielding Bible Awards work is each of 12 voters ranks 10 players at each position. A player gets 10 points for a first place vote, 9 points for a second place vote, etc. Among the voters were several prominent sabermetricians including Dewan, Bill James and Rob Neyer, BIS video scouts who studied every single game of the 2014 season in great detail, former major league outfielder Doug Glanville and knowledgeable fans who participated in the Tom Tango Fan Scouting Report.
In contrast to the Fielding Bible awards, the Gold Gloves have historically been selected by managers and coaches.  Managers and coaches still get 75% of the vote, but a statistical component - SABR Defensive Index (an aggregate of Defensive Runs Saved, Ultimate Zone Rating and Chris Dial's Runs Effectively Defended) was added in 2013.  So, it is interesting to see how the two awards compare. 

Table 1 below is a color-coded chart comparing the Fielding Bible and Gold Glove Award winners.  Blue font means the Fielding Bible and Gold Glove Awards matched and red indicates a mismatch.  Of the 18 positions, nine in each league, the Fielding Bible matched the Gold Glove in 10 cases.  There were six mismatches in the AL and two in the NL. 

The biggest disagreement in the American League was at second base where Astros second baseman Jose Altuve won a Gold Glove, but finished 7th in the AL in the Fielding Bible vote.  He finished third on the SABR Defensive Index, and apparently also gained a lot of support from managers and coaches.  Ian Kinsler of the Tigers won the Fielding Bible voting thanks in part, to his first place rank on DRS (+19) and UZR (+9) among American League second sackers.   

There were no big discrepancies the National League.  Cardinals catcher Yadier Molina won the Gold Glove for the eighth consecutive year while finishing second in the Fielding Bible voting behind Giants receiver Buster Posey.  Additionally, Giants shortstop Brandon Crawford won the Gold Glove while finishing second in the Fielding Bible vote to Andrelton Simmons of the Braves
So, are the Fielding Bible Awards better than the Gold Glove?  I like them because I believe they are less biased by reputation.  However, I do value the input of managers and coaches in the Gold Glove voting and they are trying to work some statistics into the process.  At the very least, the Fielding Bible is a nice complement to the available quantitative data and an interesting alternative to the Gold Glove Awards. I believe they are a significant contribution to the ongoing quest to more accurately assess fielding performance.

Table 1: Fielding Bibles Versus Gold Glove Awards, 2015

Fielding Bible
Gold Glove Award
Pos
AL
NL
AL
FB*
NL
FB*
C
Russell Martin
Buster Posey
Salvador Perez
2
Yadier Molina
2
1B
Mark Teixeira
Paul Goldschmidt
Eric Hosmer
2
Paul Goldschmidt
1
2B
Ian Kinsler
Dee Gordon
Jose Altuve
7
Dee Gordon
1
SS
Francisco Lindor
Andrelton Simmons
Alcides Escobar
4
Brandon Crawford
2
3B
Adrian Beltre
Nolan Arenado
Manny Machado
2
Nolan Arenado
1
LF
Alex Gordon
Starling Marte
Yoenis Cespedes
2
Starling Marte
1
CF
Kevin Kiermaier
A.J. Pollock
Kevin Kiermaier
1
A.J. Pollock
1
RF
Kole Calhoun
Jason Heyward
Kole Calhoun
1
Jason Heyward
1
P
Dallas Keuchel
Zack Greinke
Dallas Keuchel
1
Zack Greinke
1
*Indicates where Gold Glove winners were ranked on Fielding Bible

Friday, November 06, 2015

Anthony Gose Ranked Well On Lesser Known Defensive Measure

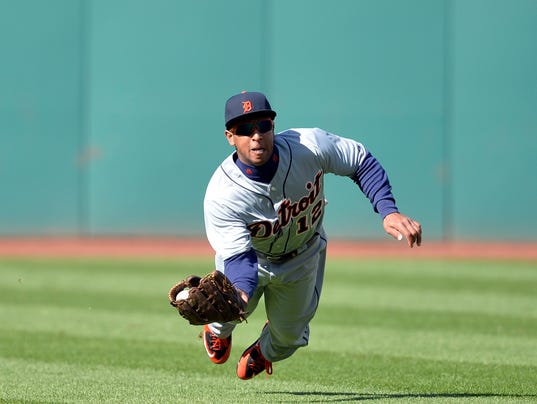
Tigers center fielder Anthony Gose ranked high on Revised Zone Rating Runs Saved statistic
(Photo credit: David Richard, USA Today Sports)

Knowledgeable Detroit Tigers fans who watched the team on a daily basis saw speedy outfielder Anthony Gose covering the vast center field of Comerica Park and considered him an asset to the team defensively.  So, they were perplexed by advanced metrics such as Ultimate Zone Rating (UZR) and Defensive Runs Saved (DRS) which suggested that he cost the Tigers 10-12 runs compared to an average center fielder.  There was however another statistic which was more in line with the observations of fans.

You might have noticed that Gose made 101 Out of Zone plays (OOZ) according to Baseball Information Solutions. This is good for fourth best among major league center fielders.  He did not rank nearly as well on the complementary statistic - Revised Zone Rating (RZR).  He had an RZR of .906 which means that he made 90.6% of the plays in his zone.  That placed him in the bottom third of center fielders.  The two measures together suggest that he had very good range, but was not as reliable turning more routine plays into outs.

There is a common misconception that RZR and OOZ are connected to either DRS and UZR, but they are not.  Whereas DRS and UZR break each position into several zones and treat each sub-zone differently, RZR and OOZ only have one zone for each position.

Some fans have asked whether RZR and OOZ can be translated into runs like the more complex defensive measures.  A few years ago, Statistics Analyst Colin Wyers (who now does his work for the Houston Astros) developed an algorithm which combined RZR and OOZ and translated these numbers into plays made above average (PMAA) and runs saved above average (RSAA). 

Wyers' algorithm has a lot of steps.  If you don't want to see all the math, you can jump to the table at the bottom of the post and look at the PMAA and RSAA columns.  Anyway,  Gose had the following numbers in 2015:

Innings = 1,120
Balls in Zone (BIZ) =  277
In Zone Plays = 251 
RZR = .906
OOZ = 101

First calculate the average RZR for center fielders (proportion of all plays in the zone successfully converted to outs) and consider that to be the expected RZR (EXPRZR) for each player.  From that, calculate the plays made in zone above/below the league average (PIZAA) for each player:

          PIZAA  = In Zone Plays - BIZ*EXPRZR

The average RZR for MLB center fielders in 2015 was about .914.  So, Gose's PIZAA = 251 -  277 x .914 = -2.  Thus, he made an estimated 2 plays in the zone below what would expect from an average center fielder.  

Next, assume that the number of balls hit outside the zone is correlated with the number of innings (a big assumption, but the best we can do given the available data). Then calculate OOZ per inning for all players combined at each position (EXPORATIO).  Compute, for each player, the plays made outside the zone above/below the MLB average (OOZAA):

          OOZAA = Out of Zone Plays - Innings*EXPORATIO

The EXPORATIO for center fielders in 2015 was .069.  So, Gose's OOZA was 101 - 1,120 x .069 = 24.  This means that he made an estimated 24 plays outside the zone above what you would expect from an average center fielder.  

Next, combine plays made inside the zone and plays made outside the zone to get plays made above average (PMAA):

           PMAA = PIZAA + OOZAA

Gose's PMAA was -2 + 24 =22.  So, he made an estimated 22 more plays than would be expected by an average center fielder.  

Some time ago, analyst Chris Dial (now a member of the Board of Directors for the Society for American Baseball Research - aka SABR) estimated that the average play made by a center fielder saves .842 runs.  So, we can estimate the runs saved/cost (RSAA) by  a center fielder as:

          RSAA = .842*PMAA

For Gose, that comes out to RSAA=19.  Thus, he saved the Tigers an estimated 19 runs defensively compared to an average centerfielder.  That is a lot better that the -10 and -12 he netted on UZR and DRS respectively.  

Table 1 below shows the statistics for all MLB center fielders with 900 or more innings in 2015.  You can see that Gose ranked fourth in baseball on RSAA.  The MLB leader was Royals fly catcher Lorenzo Cain (35) followed by Kevin Pillar of the Blue Jays (34).

Is RSAA any better than UZR or DRS or other advanced defensive metrics.  Probably not, but it has the advantage of dividing plays into inside the zone and outside the zone, which is information we don't get from other metrics.  As always, take these numbers with a grain of salt.  It is always preferable to look at multiple metrics and years when dealing with defensive data.  

In this case, the numbers on Gose are all over the place, so this might be one of those times where you need to make a judgement based on your own observation or the observation of others whose scouting instincts you trust.  

Table 1 Center fielder Runs Saved Leaders, 2015
Player
Team
Inn
RZR
OOZ
PIZ AA
OOZ AA
PMAA
RSAA
Lorenzo Cain
KCR
1,173
.942
114
8
34
42
35
Kevin Pillar
TOR
1,236
.954
113
12
28
41
34
Kevin Kiermaier
TBR
1,174
.928
100
5
19
24
20
Anthony Gose
DET
1,120
.906
101
-2
24
22
19
Odubel Herrera
PHI
1,065
.930
90
4
17
21
18
Mookie Betts
BOS
1,157
.935
93
5
14
19
16
A.J. Pollock
ARI
1,303
.924
104
3
15
17
15
Michael Taylor
WSN
802
.948
66
6
11
17
14
Juan Lagares
NYM
999
.916
81
1
13
13
11
Billy Hamilton
CIN
975
.949
69
8
2
10
8
Mike Trout
LAA
1,362
.933
96
7
3
9
8
Michael Bourn
- - -
858
.929
65
3
6
9
8
Carlos Gomez
- - -
959
.910
68
-1
2
1
1
Cameron Maybin
ATL
1,129
.867
90
-13
13
-0
-0
Jacoby Ellsbury
NYY
948
.925
60
2
-5
-3
-3
Austin Jackson
- - -
939
.895
65
-4
1
-4
-3
Dexter Fowler
CHC
1,324
.925
80
3
-11
-8
-7
Adam Jones
BAL
1,168
.918
71
1
-9
-8
-7
Joc Pederson
LAD
1,223
.929
72
3
-12
-9
-7
Charlie Blackmon
COL
1,209
.879
83
-9
0
-9
-7
Adam Eaton
CHW
1,280
.917
77
1
-11
-10
-8
Marcell Ozuna
MIA
924
.891
58
-5
-5
-10
-8
Billy Burns
OAK
1,066
.933
56
5
-17
-12
-10
Angel Pagan
SFG
1,061
.889
50
-6
-23
-29
-24
Andrew McCutchen
PIT
1,374
.913
50
-0
-44
-45
-38
Data source: FanGraphs.com

Twitter

Blog Archive

Subscribe

My Sabermetrics Book

My Sabermetrics Book
One of Baseball America's top ten books of 2010

Other Sabermetrics Books

Stat Counter