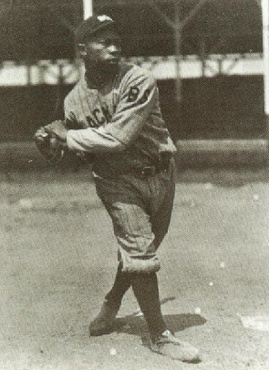
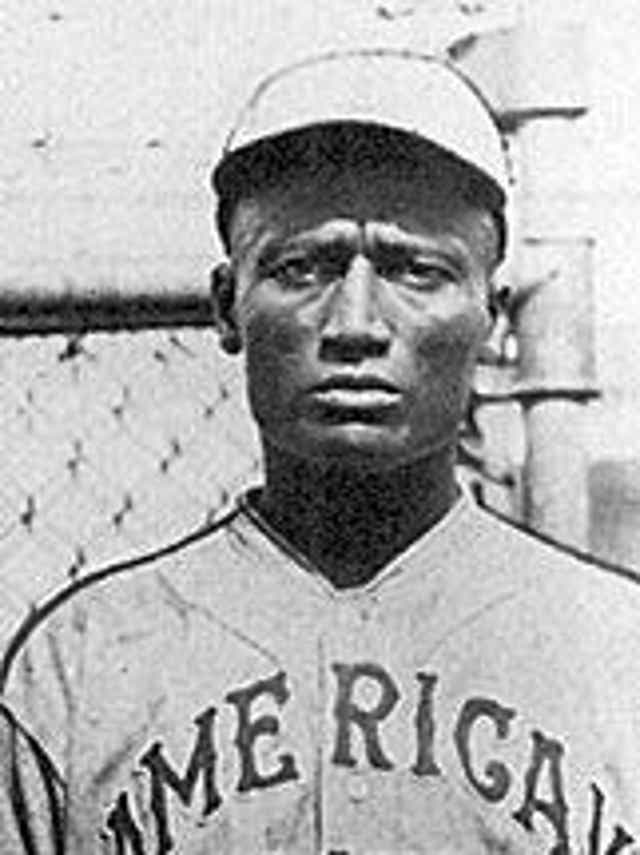
Wade Johnston was the starting left fielder for the Detroit Stars from 1928-1931. (Photo credit: Wikipedia.com)
In recent posts, I have integrated Detroit Stars players into the all-time Detroit major league position lists. The difficulties involved in ranking Negro League players are discussed in the Detroit Stars all-star team post. The complete list of position ranks is shown below:
Catchers first basemen Second Basemen shortstops Third Basemen
center fielders Right Fielders Starting Pitchers relievers
This week, I am looking at left fielders. Before Negro League data was so conveniently available at Seamheads.com, I listed the top ten left fielders in Detroit Tigers history. The one Stars left fielder who warrants consideration on this list is Wade Johnston.
William Wade Johnston started out with the Cleveland Stars in 1921 and joined the Detroit Stars in 1928. He became their starting left fielder for four years batting .312 with a .392 on base percentage. He was small at five-foot-seven-inches tall and 142 pounds, but he had good power, In 1929, he finished third in the Negro National League in both homeruns (16) and OPS+ (173). He apparently had some patience as he led the league with 35 walks in just 200 plate appearances in 1931.
There have been a lot of slugging outfielders in Detroit Tigers history which makes it difficult to crack the outfield lists, but left field is a little easier than right field. Johnston had 6 WAR which translates to about 9-10 WAR in 154 game seasons. Johnston's four prime years and Hall of Famer Goose Goslin's four twilight years with the Tigers are comparable. Johnston noses out Goslin due to his spectacular 1929 season and takes the #10 spot.
The rest of the list is shown below.
1. Bobby Veach (1912-1923 46 WAR 230 ABR 130 OPS+) According to Fred Lieb in The Detroit Tigers, Bobby Veach "was a happy-go-lucky guy, not too brilliant above the ears...He was as friendly as a Newfoundland pup with opponents as well as teammates." He was also the best left fielder in Tigers history amassing 4 WAR or higher 7 times and finishing in the top ten in OPS and slugging five times. His best season was 1919 when he had 6.7 WAR and a 158 OPS+. In the Bill James Historical Baseball Abstract, James rated the 1915 trio of Veach, Ty Cobb and Sam Crawford as the best single-season outfield in baseball history
2. Willie Horton (1963-1977 26 WAR 167 ABR 127 OPS+) Born and raised in Detroit, Willie Horton was a home town favorite for his performance both on and off the field. He helped to restore order during the 1967 riots by climbing onto a truck and pleading with fellow African Americans to stop looting and committing violence. On the field, he was a top slugger for many years finishing in the top ten in home runs five times and slugging four times. He was at his finest during the 1968 championship season hitting 36 home runs and posting a 165 OPS+.
3. Rocky Colavito (1960-1963 17 WAR 91 ABR 130 OPS+) Rocky Colavito came from the Indians in 1959 in a famous of swap of the batting leader (Harvey Kuenn) and home run leader (Colavito). Colavito played four year with the Tigers including a fantastic 1961 season with 45 homers and a 157 OPS+. He finished in the top five in WAR in both 1961 and 1962. He also had perhaps the best outfield arm in the majors during his prime.
4. Bobby Higginson (1995-2005 23 WAR 91 ABR 113 OPS+) Some will be surprsied at Bobby Higginson's fairly high WAR total and his high ranking on this list. Because he never played for a winning team and faded badly late in his career many fans do not remember Higginson fondly. However, he had a very solid career reaching 3+ WAR four times and 2+ WAR six times in all. His best season was 2000 with he hit .300/.377/.538 with 5.3 WAR.
5. Charlie Maxwell (1955-1962 19 WAR 81 ABR 120 OPS+)
6. Steve Kemp (1977-1981 16 WAR 92 ABR 125 OPS+) Steve Kemp is more famous for whom he was traded (center fielder Chet Lemon in 1981) than his performance, but he was a productive hitter for the Tigers. He averaged a 132 OPS+ and 3.7 WAR between 1978-1981.
7. Dick Wakefield (1941-1949 13 WAR 88 ABR 131 OPS+) According to Donald Honig in Between the Lines, outfielder Dick Wakefield was one of baseball's first bonus babies when he signed with the Tigers for $52,000 out of the University of Michigan in 1941. The 6'4", 210-pound outfielder quickly lived up to his promise with 3.4 WAR and a league leading 200 hits. He was off to an excellent start the next season, batting a gaudy .355 with a 190 OPS+ before being drafted into the military. He returned to the majors in 1946, but never again reached the same lofty level. In all, he had four years of 2+ WAR. 8. Matty McIntyre (1904-1910 17 WAR 40 ABR 112 OPS+) Matty McIntyre is best remembered as being being part of the clique that tormented Ty Cobb during his early years with the Tigers, but he also performed well on the field reaching 2+ WAR four times. His best season 2008 when he had 6 WAR and led the league with 258 times on base.
9. Fats Fothergill (1922-1930 13 WAR 67 ABR 122 OPS+) 5'-10", 230-pound Bob Fothergill was give the unflattering nickname "fats" or "fatty" early in his career, but his popularity with fans also earned him the name "People's Choice". Fothergill averaged 135 OPS+ and 2.9 WAR from 1926-1929.
10. Wade Johnston (1928-1931 6 WAR 51 ABR 135 OPS+) Profile shown above.
First baseman Edgar Wesley's 213 OPS+ in 1925 was the best in Detroit history. (Photo credit: Seamheads.com)
In recent posts, I have integrated Detroit Stars players into the all-time Detroit major league position lists: shortstops center fielders
This week, I am looking at first basemen. Before Negro League data was so conveniently available at Seamheads.com, I listed the top ten first basemen in Detroit Tigers history. The two Stars first basemen with enough playing to merit consideration for the all Detroit top ten list are Edgar Wesley and Ed Riles.
Edgar Wesley was a big left-handed slugger and strong defensive first baseman and was considered the best all around player at his position in the early years of the Negro National League. He was also known to be an aggressive base runner. Indianapolis catcher Larry Brown recalled Wesley barreling into home plate so hard that he cut his chest protector: "My mask went one direction, my glove went the other and the ball went up to the stands" (Richard Bak, Turkey Stearnes and the Detroit Stars).
In seven years with the Stars, Wesley hit .323 with a 153 OPS+. He played with the Stars from 1920-1923, skipped to to Harrisburg Giants of the Eastern Colored League in 1924 and then back to the stars from 1925-1927. Negro Leaguer players made very little money and thus often moved from team to team looking for better deals. Interestingly, they were more free to move around than white major leaguers who were subject to the reserve clause.
Wesley led the league with 11 home runs in 1920, but his best year came in his second stint with the Stars. The powerful first sacker had a monster year in 1925 leading the league in batting (.404), slugging percentage (.715) and OPS+ (213). He also hit 17 home runs in 264 plate appearances which was second to his legendary teammate Turkey Stearnes (19). The lofty 213 OPS+ was the highest in Detroit history including Tigers batters.
Edward "Huck" Rile was a two-way player (first baseman and pitcher) who played for 11 teams over 14 seasons. At six-feet-six-inches and 230 pounds, Rile was one of the biggest players in Negro Leagues history. Huck excelled on both sides of the ball with a lifetime OPS+ of 122 and ERA+ of 110.
The switch hitting Rile had a fantastic season as both a batter and pitcher for Detroit in 1927. At the plate, he hit .389 with a .660 slugging average and finished second in the league with a 188 OPS+ in 297 plate appearances. From the mound, he was second in the league with a 157 ERA+ in 141 innings. He didn't pitch a lot in 1928, but continued to excel offensively batting .348 with a 147 OPS+.
Wesley, whose 16 WAR translates to roughly 27 over 154 games, fits comfortably as Detroit's fifth best first baseman of all time between Rudy York and Cecil Fielder. Rile had only three full-seasons with the Stars, but gets a boost for his pitching performance earning a #8 ranking.
The rest of the list is shown below.
1. Hank Greenberg 1930-1946 54 WAR 418 ABR 161 OPS+
Baseball's first Jewish superstar, Greenberg was inducted into the Hall of Fame in 1956. The "Hebrew Hammer" won MVP awards in both 1935 and 1940 and played on all four Tigers World Series teams (1934, 1935, 1940, 1945) of the '30s and '40s. He led the league in home runs four times and finished in the top five in OPS and slugging average seven times. Other notable Greenberg feats include 58 home runs in 1938 and 184 RBI in 1937, both the highest single-season total in Tigers history.
2. Miguel Cabrera 2008-2018 51 WAR 405 ABR 155 OPS+
Acquired from the Marlins in an eight-player deal in 2007, Cabrera has dominated the American League for most of his tenure with the Tigers. The Venezuelan slugger won the Triple Crown with a .330 batting average, 44 home runs and 139 RBI in 2012, but that might not have been his best season. In 2013, he won the sabermetric triple crown with a .348/.442/.636 slash line. He finished in the top five in the league in in Adjusted Batting Runs every year from 2009-2016 and led the league every year from 2010-2013.
3. Norm Cash 1960-1974 52 WAR 319 ABR 139 OPS+
"Stormin' Norman" had a monster season in 1961 batting .361/.487/.662 with a 201 OPS+. His 85 Adjusted Batting Runs that year was the highest total in franchise history. He has since admitted to using a corked bat that year which puts the legitimacy of those numbers in doubt. His highest OPS+ otherwise was 149, but was 120+ every year from 1960-1973. He had 12 seasons of 2+ WAR and 9 seasons of 3+ WAR.
4. Rudy York 1934-1945 32 WAR 175 ABR 128 OPS+
On August 4, 1937, the Tigers were stuck in a five game losing streak and suffering from a shortage of healthy players. With all their regular catchers injured, manager Mickey Cochrane decided to try Rudy York, the rookie without a position, as the starting catcher. He proceeded to hit an amazing 18 homers with 49 RBI for the month. Some 81 years after his big month of August, Big Rudy still holds the the American League record for most home runs in a month. York eventually became the regular first baseman in 1940 when Greenberg was moved to left field. He finished in the top five in home runs eight times and top ten in OPS five times.
5. Edgar Wesley 1920-1927 16 WAR 112 ABR 153 OPS+ Profile posted above
6. Cecil Fielder 1990-1996 17 WAR 112 ABR 126 OPS+
In the Bill James Historical Abstract, James said that Cecil Fielder was "A big fat guy who hit home runs for a few years". That was a reference to Fielder being overrated, but it was a bit harsh. He was a productive hitter during those years and his 1990 season was one of the most memorable individual seasons I have seen. He was signed as a low profile free agent in January, 1990 after returning from a season in Japan. The big first baseman then surprised the baseball world by posting an OPS+ of 167 and leading the league with 51 home runs and 132 RBI. He never replicated that season, but he had five more seasons of 30+ home runs including a league leading 44 in 1991.
7. Lu Blue 1921-1927 21 WAR 82 ABR 110 OPS+
Blue had four more WAR than Cecil Fielder, but that was largely because Fielder was penalized for being designated hitter for parts of seasons. Because first base is mostly a hitting position, I decided to ignore that penalty. Fielder was the better offensive player, so I moved him up a notch. Blue was no slugger, but he was an on-base machine posting on-base percentages of .400 or better five times with the Tigers. He was also a model of consistency with the following WAR totals from 1921-1926: 2.9, 3.6, 3.3, 3.3, 3.7, 2.8.
8. Ed Rile 1927-1930 10 WAR 76 ABR 150 OPS+ Profile posted above
9. Darrell Evans 1984-1988 15 WAR 61 ABR 121 OPS+
Everyone was surprised when tightwad GM Bill Campbell signed free agent Darrell Evans after the 1983 season. It was the first time the Tigers had dipped into the free agent pool in a significant way and it paid off, although not right away. He hit only 16 home runs with a 105 OPS+ during the 1984 championship season and it looked like he might be all done at age 37. However, he went on to average 34 home runs over the next three seasons including a league-leading 40 in 1985. His best season was 1987 when he had 4.9 WAR and a 135 OPS+ at age 40.
10. Tony Clark 1995-2001 12 WAR 62 ABR 121 OPS+
Tony Clark was the second overall pick in the 1990 amateur draft and played seven seasons for the Tigers. He was regarded as a disappointment by many fans due to his advance billing and misfortune of being one of the better hitters on some very bad teams. He posted an OPS+ of 120 or better five times and hit 30 or more round trippers three times.
Note: Most of the data for this post were abstracted from Baseball-Reference.com
Bill Riggins was a fixture at shortstop for seven years with the Detroit Stars.
In a recent post, I examined Detroit Stars' outfielders "Turkey" Stearnes and Pete Hill and compared them to the Tigers top center fielders throughout history. I also discussed some of the challenges in evaluating Negro League players. In this post, I will look at the Detroit shortstops
Before it was announced that Black baseball leagues would be recognized as major leagues and before Negro League data was so conveniently available at Seamheads.com, I listed the top ten shortstops in Detroit Tigers history. The only Stars shortstop with enough playing to consider for the all Detroit top ten list is Bill "Mule" Riggins.
There is some confusion about Riggins' real name. It appears that he was named Arvell at birth, but it's often spelled Orville (Agatetype.typepad.com). During his playing career, he went by the name Bill or "Mule". Before his playing career, he worked in the coal mines of Southern Illinois. Mule was a heavy drinker, but it didn't seem to affect his playing skills as his resume is fairly impressive.
Riggins was regarded as an excellent fielder and baserunner who Bill James ranked as the fifth best shortstop in Negro League history (The New Bill James Historical Baseball Abstract). The switch hitting shortstop played with the Stars from 1920-1926 batting .286 with a 102 OPS+ in 538 games.
In 1926, Riggins batted .300, finished second in the league in stolen bases (25) and fifth in runs scored (80). He also finished second in steals in 1925 with 26. In both cases, the league leader was Cool Papa Bell, the fastest runner in Negro League history.
One of the big questions in ranking Riggins is just how good was his defense. This same questions looms for all Negro League as well as white players who played prior to the availability of play-by play data. According the Defensive Regression Analysis from Michael Humphreys (Wizardry), Riggins saved 34 runs with his glove in seven seasons. That number can be found at Baseball-reference.com as RField. It says that Riggins saved five runs per season or about nine runs over an equivalent 154 game season.
Combining Mule's defense with his offense would yield 14 WAR (about 25 WAR with 154-game seasons). Unlike 1930s Detroit Tiger shortstop Billy Rogell, who is shown to be a strong defender by multiple measures, we have only a single defensive metric for Riggins. Thus, we have less confidence in his evaluation.
As for the all-time rankings, Alan Trammell is the top Detroit shortstop by a wide margin followed by Dead-Ball era shortstop Donie Bush. The next tier includes Riggins, Billy Rogell, Carlos Guillen and Harvey Kuenn. Riggins and Rogell are the better fielders while Guillen and Kuenn are the better hitters.
Riggins could be ranked as high as number three at the position, but there is not enough information for me to feel comfortable placing him that high. I am ranking him fifth behind known defensive whiz Rogell and Guillen the best offensive player of this group. The rest of the list is shown below.
1. Alan Trammell (1977-1996 70.7 WAR 63.0 OWAR 110 OPS+)
I posted to this blog regularly for about 10 year and during that time I often discussed Alan Trammell's Hall of Fame credentials. So, it is good to be able to refer to him as "Hall of Fame shortstop Alan Trammell". Arguments which say that player X is in the Hall of Fame and player Y is better than player X are flawed because there is a chance that player Y is only better than one guy who doesn't really belong. In Trammell's case, my argument was always that he was better than half the shortstops in the Hall of Fame. He is 8th among 21 inducted shortstops in WAR, 9th in Wins Above Average (preferred by some for Hall of Fame discussions because it puts more weight on excellence and a little less on longevity than WAR), 9th in OWAR and 11th in OPS+. So, now he's in and he's the only Tigers shortstop so honored.
2. Donie Bush (1908-1921 38.5 WAR 43.1 OWAR 92 OPS+)
According to the Biographical Encyclopedia of Baseball, Bush spent 65 years in organized ball as a player, manager, scout and owner. That's a lot of baseball - from the first decade of the American League's existence to the early 1970's or from Ty Cobb to Marvin Lane. This ranking is strictly based on his time as a player with the Tigers though. He played more games at shortstop (1,867) than any Tiger other than Trammell and had some excellent individual seasons exceeding 5+ WAR five times. His best year was his 2009 rookie campaign when he had 6.5 WAR, an OPS+ of 115 and a league leading 88 walks (one of five times he led the league in walks).
3. Billy Rogell (1930-1939 24.9 WAR 19.4 OWAR 89 OPS+) Bill Rogell was one of the top defensive shortstops in the league in a Tigers career which spanned the the 1930s. A long-time Detroit City Council member after his playing days, Billy Rogell teamed with Hall of Fame second baseman Charlie Gehringer as the keystone combo of the 1934-35 pennant winning teams. He could hit pretty well for a middle infielder too averaging 5.1 WAR and a 101 OPS+ from 1933-1935.
4. Carlos Guillen (2004-2011 18.6 WAR 22.9 OWAR 121 OPS+)
Carlos Guillen was acquired from the Mariners before the 2004 season in what turned out to be one of the team's best trades ever. He was an integral member of a team that became a perennial contender after two decades of futility. Guillen was neither durable nor a plus defender, but nobody questioned his offense. His combined good on-base skills and solid middle infield power produced an OPS+ of 100 or more six times. His 136 OPS+ and 6.0 WAR in 2006 made him probably the best player on a team that made the playoffs for the first time since the 1980's.
5. Bill Riggins (2020-2026 14.4 WAR 11.1 OWAR 102 OPS+) See above for profile
6. Harvey Kuenn (1952-1959 21.0 WAR 25.6 OWAR 112 OPS+) Kuenn's reputation and numbers as a defensive shortstop were very poor which is why he became an outfielder at age 27. That hurts his his ranking at a position where defense is crucial. He could hit though. His best season was 1959 when he hit .353 to win the American League batting title. Interestingly, he was traded to the Indians after the season for outfielder Rocky Colavito who led the league in home runs in 1959. This trade also turned out great for the Tigers.
7. Topper Rigney (1922-1925 10.9 WAR 13.0 OWAR 105 OPS+
Topper Rigney played only three full seasons, but was one of the Tigers best offensive shortstops. He posted an OPS+ of 108 from 1922-1924.
8. Jhonny Peralta (2010-2013 9.1 WAR 9.2 OWAR 106 OPS+)
Peralta always looked awkward and out of place at shortstop, but he consistently posted average numbers on defensive metrics and continued to do so when he joined the Cardinals in the National League. He was certainly a solid hitter for a shortstop two times posting an OPS+ above 120. He and Rigney are interchangeable on this list. I chose Topper because I liked his name, but the odd spelling of Jhonny's first name made this a a tough choice.
9. Kid Elberfeld (1901-1903 8.1 WAR 8.0 OWAR 109 OPS+)
The 5'-7" 158 pound Elberfield was the the epitome of grit. According to the Biographical Encyclopedia of Baseball, The Tobasco Kid was spiked often and when cut he would go back to the bench, cauterize his wound with whiskey and then continue playing. He only played two full seasons for the Tigers, but was fourth among Tigers shortstops in OPS+.
10. Jose Iglesias (2013-2018 7.1 WAR 6.5 OWAR 83 OPS+)
Iglesias makes this list because we have run out of guys that could hit and he was a highlight reel at shortstop during his Tigers career. Including good field no hit Eddie Brinkman of the 1970s Tigers would have allowed me to talk about another great Tigers trade, but his numbers didn't match up.
 Detroit Stars outfielder "Turkey" Stearnes was inducted into Baseball's Hall of Fame in 2001
Near the end of 2020, Major League Baseball announced that it would officially recognize seven professional Negro Leagues that operated between 1920-1948 as major leagues. Historians have long considered baseball played in these leagues as comparable in quality to the White major leagues. It is about time that they these leagues get their due recognition.
It is of course tragic that the Black leagues were not integrated with the White leagues and shameful it has taken so long for them to be classified as major leagues. Since the merger, more baseball writers and analysts have begun to delve into the records and stories in order to make the rich history of the Negro Leagues more widely known.
Of particular interest to me is trying to integrate the statistics of Black and White leagues so we can evaluate and compare players from both sets as if it was one organization where they all played together. In the past, I have ranked Detroit Tigers players by position. What would these lists look like if Detroit Stars players were included? In this post, I will look at center fielders in particular.
It is important to understand the challenges of analyzing Negro League data. Hall of Fame historian Jay Jaffe discussed these issues in a FanGraphs article. I will summarize some of them here: - Negro Leagues statistics are only about three quarters (73%) complete according to Ben Lindbergh, writer at The Ringer. It varies by era depending on how frequently newspapers printed box scores and accounts. For example, the 1920s era is mostly complete while the 1940s era is only about half complete.
- Seasons prior to 1920 will be excluded. For example, Hall of Fame outfielder Pete Hill played for the Chicago American Giants, one of the greatest Black teams ever, from 1911-1918 but those years will not be counted in official major league statistics. His statistics from 1920-1925 with the Detroit Stars and other teams will count.
- Seasons after 1948 will be excluded. So, seasons for players, such as Hank Aaron and Ernie Banks, playing in the highly competitive Negro American League from 1949-1962 will not be recognized.
- Players like Jackie Robinson who played in both the Negro Leagues between 1920-1948 and also the White major leagues will have their official total statistics altered to include their time in the Negro Leagues.
- The Negro Leagues had shorter official seasons - usually somewhere between 50 and 100 games - than the White majors. Teams may have played 100 or more additional games outside of league play often against inferior local teams, but these games will not be counted.
- The official site for Negro Leagues statistics is Seamheads.com. It is a fun site and you should get to know it.
While there is some guess work involved in comparing players from Black and White leagues, most historians who have looked at this issue believe that the best players in Black leagues were comparable to the best players in White leagues. The best evidence of this may come from examination of the performance of Black players in the time following integration starting with Jackie Robinson.
To this end, Hall of Stats creator and Seamheads analyst Adam Darowski, tabulated the top 40 position players in Major League Baseball by Wins Above Replacement in the three decades following integration and noted that 21 of the 40 players were Black.
I have already listed the top ten Detroit Tigers center fielders. The greatest Detroit Star was center fielder Turkey Stearnes. Where would he rank on this list and are there any others Detroit Stats who should be considered? The Detroit Stars were established as an independent league team in 1919 and became a founding member of the Negro National League in 1920. The Stars played through 1931 when the Negro National League collapsed due to the great depression. A different Negro National League was established in 1933. The Detroit Stars played in the league the first year, but were not very successful and played under 40 games. In this analysis, I am going to look at 1919-1931. While 1919 is not officially recognized as a major league season, they had a strong team in a competitive league that year.
Norman Thomas "Turkey" Stearnes was the top player in Detroit Stars history and one of the best in Negro Leagues history. He was inducted into the baseball Hall of Fame in 2000.
Stearnes was quiet and unassuming off the field, but he was a dynamic player on the field. The legendary Satchell Paige once said that Stearnes "was one of the greatest hitters we ever had. He was as good as Josh (Gibson). He was as good as anybody who ever played" (BaseballHall.org).
If Turkey played today, he would be described as a five-tool player. Legendary Negro League outfielder Cool Papa Bell said "that man could hit the ball as far as anybody and he was one of our best all around players. He could field, he could hit, he could run. He had plenty of power. (BaseballHall.org).
The left-handed hitting Stearnes batted .348 with a 173 OPS+ (seventh best in Negro League history) in 1,049 games lifetime. His 199 home runs was the third most behind Gibson (238) and Oscar Charleston (211) in recorded Negro Leagues history. Between 1920-1948, the seasons now recognized as Major Leagues, his 199 homers was more than any Negro League player. He was truely one of the all-time greats.
In nine years with the Stars (1923-1931), Stearnes posted a 175 OPS+ (4th overall for the time period), 144 homers (1st) and a .661 slugging average (2nd). He lead the league in home runs four times and in OPS+ twice. He finished in the top ten in OPS+ every year and the top five seven times.
I am going to rank Stearnes number two behind the legendary Ty Cobb and ahead of Chet Lemon, but he is closer to Cobb than Lemon.
The other center fielder to consider is Hall-of-Fame outfielder Pete Hill. Hill played most of his career in the pre-Negro League era prior to 1920. His organized baseball years ran from 1899 to 1925 and he was one of the pioneers of Negro League Baseball. He was the captain of Rube Foster's Chicago American Giants from 1911-1918, the most dominant African American team of the time. Foster created the Detroit Stars in 1919 and named Hill the manager. Foster then organized the Negro National League in 1920 and the Stars were one of the original franchises.
Negro League statistics were not accurately kept or well published and statistics for Black baseball prior to 1920 were even worse, but Hill was considered an excellent fielder with a cannon arm and great glove. Offensively, he was a line drive hitter and a speedy base runner. His 167 OPS+ is 13th in recorded Negro League history. Prominent baseball historian and author of Biographical Encyclopedia of Negro League Baseball James Riley said that he would include Ty Cobb, Tris Speaker and Pete Hill in his pre-1920 era all star outfield.
Had he played with the Stars for longer, Hill would probably rank number three behind Cobb and Stearnes. Unfortunately, Hill's days with the Detroit Stars did not come until he was 36 years of age in 1919. He was a player manager from 1919-1921 and he could still hit. He put up Ruthian numbers in 1919 batting .396 with 16 home runs and a 273 OPS+ in 165 plate appearances. He followed that up with OPS+ of 139 and 153 in 1920 and 1921 respectively. Hill was inducted into the Baseball Hall of Fame in 2006.
Hill's numbers with the Stars were spectacular, but it was only three years and 589 plate appearances, so he needs to be placed behind some Detroit Tigers hitters with longer careers and more data. He had six WAR in those 589 plate Appearances. If we had all the data and the Stars played an official schedule of 154 games those years, we can guess that he may have accumulated 18 WAR. It is tough to rank him, but I am going place him fifth between Curtis Granderson and Barney McCosky.
The rest of the list is shown below.
1. Ty Cobb (1905-1926 145 WAR 1,106 ABR 171 OPS+)
Ty Cobb is the easiest choice for number #1 of any position. Much has been said about his character flaws and there are debates about whether he was truly a bad person or just a product of his time period. It's probably some complex combination of both, but there are no doubts about his talents as a player as he is inarguably at the top of the list of the game's all-time greats. He is 4th in lifetime WAR behind Babe Ruth, Barry Bonds and Willie Mays and second in Offensive WAR behind Ruth. He led the American League in batting average twelve times, slugging eight times, OPS ten times and the list goes on and on.
2. Turkey Stearnes (1923-1931 33 WAR 176 OPS+)
See above for career profile.
3. Chet Lemon (1982-1990 31 WAR 102 ABR 117 OPS+)
Chet Lemon was acquired from the White Sox for left fielder Steve Kemp in 1981 and became one of the important pieces of the successful Tigers teams of the 1980's while Kemp's career was marred by injuries. Lemon was known to do some odd things on the bases like frequently diving head first into first base, but he more than made up for questionable base running with above average offense and excellent defense. In nine seasons with the Tigers, Lemon reached 2+ WAR eight times and 3+ WAR five times. His best year in Detroit was the 1984 championship season where he had a 135 OPS+ and 6.2 WAR.
4. Curtis Granderson (2004-2009 21 WAR 54 ABR 114 OPS+)
Curtis Granderson is the best home-grown Tigers position player since the 1980s and was a big fan favorite during his time in Detroit. He went out of his way to connect with fans as much as any player since I became a fan in 1968 and he was also talented. He was an above average hitter, fielder and base runner and was 3+ WAR in each of his four full seasons with the Tigers. His best year was 2007 when he was 7.6 WAR and one of only five players ever to achieve the quad twenty - 20 doubles, 20 triples, 20 home runs and 20 stolen bases.
5. Pete Hill (1919-1921 6 WAR 185 OPS+)
See above for career profile.
6. Barney McCosky (1939-1946 13 WAR 47 ABR 110 OPS+)
Barney McCosky was a lead-off hitter and strong defender who had a .384 OBP and 3.4 WAR as a rookie in 1939. He had an even better year in 1940 batting .340 with a league-leading 19 triples and 4.0 WAR in helping the Tigers to a pennant. He was 2+ WAR in each of his first four years as a Tiger before missing three prime seasons serving in World War II from 1943-1945. If we assume conservatively that he was 2 WAR in each of those three seasons, he would have been 19 WAR as a Tiger. So, he gets a bump on this list for that.
7. Ron Leflore (1974-1979 14 WAR 84 ABR 108 OPS+)
Ron Leflore did not begin playing baseball until he was 22 and in the State Prison of Southern Michigan in Jackson, a maximum security facility where they send the worst criminals. He was so talented that a fellow prisoner with connections to Tigers manager Billy Martin helped get him a try out. According to Baseball: The Biographical Encyclopedia by David Pietrusza, et al, Leflore was a given a tryout at Tiger Stadium while on a 48-hour furlough in June, 1973. A year later, he was in the majors and he soon became one of the more exciting players in the game. In 1976, he batted .316 including a 30-game hitting streak and stole 58 bases. The speedy Leflore led the league with 68 steals in 1977. He was 3+ WAR each season from 1976-1979, but was traded to the Expos for pitcher Dan Schatzeder because he became a clubhouse problem.
8. Austin Jackson (2010-2014 20 WAR 36 ABR 105 OPS+)
Austin Jackson came to the Tigers along with pitchers Max Scherzer, Phil Coke and Daniel Schlereth in a seven player three-team deal which also saw Granderson go to the Yankees. Jackson was primarily a defensive outfielder but was an average hitter and good base runner. He averaged 4.7 WAR from 2010-2013 (FanGraphs WAR is a little less generous at 3.7 per year due mostly to a different fielding statistic). His best season was 2012 when he had a 129 OPS+ and 5.5 WAR.
9. Jimmy Barrett (1901-1905 14 WAR 51 ABR 117 OPS+)
Jimmy Barrett was one of the players that hazed and infuriated Ty Cobb in his early days as a Tiger. Barrett also wasn't on the best of terms with his manager Edward Barrow. In Barrow's autobiography My Fifty Years in Baseball, he writes that Barrett said to him: "Mr. Barrow, your methods take all the individuality away from a player" Barrow responded: "Young man, if you ever speak to me that way again, I will take more than your individuality away from you. I will knock your block off." So Barrett was not the easiest guy to get along with but he was a solid player both offensively and defensively. Barrett was the Tigers first star in their opening season in 1901 with a 108 OPS+, strong defense and 2.7 WAR. His best season was 1903 when he led the league with a .407 OBP and had an OPS+ of 144.
10. Hoot Evers (1941-1952, 1954 14 WAR 44 ABR 112 OPS+)
According to Baseball: The Biographical Encyclopedia, Walter Arthur Evers got his nickname because he "hooted" as a baby. Hoot averaged 3.2 WAR and a 125 OPS+ between 1947-1950. His best season was 1950 when he batted .323/.408/.551 with a 141 OPS+.
I always begin any Hall of Fame discussion with a reminder that long-time Tigers second basemen Lou Whitaker has the highest career Wins Above Replacement among 20th Century position players not in the Hall and not connected to steroids or gambling. Whitaker will likely get another shot in the future, but was not on any of the ballots this year, so let's turn our attention to the upcoming Baseball Writer's Association of America ballot (BBWAA). There were no new inductees selected by writers in 2021, so the ballot of worthy candidates remains crowded largely due to confusion and division on how to deal with players linked to the Performance Enhancing Drugs (PEDs). Many holdovers and a few worthy new candidates still make the vote a challenge though. There are 30 eligible players and writers can vote for up to 10 candidates. I, of course, do not have a vote, but will fill my theoretical ballot here. My selection process involves comparing players to their contemporaries, other players at the same position and current Hall-of-Fame members. I value peak performance and career performance equally. I use many traditional and advanced statistics, most of which can be found on Baseball-Reference and FanGraphs. Some of my favorites are plate appearances, batting average, on-base percentage, slugging average, batting runs, wOBA,and WAR for hitters and innings pitched, ERA, pitching runs, strikeouts and WAR for pitchers. I used multiple WAR statistics in my analysis, but any reference to WAR cited below is Baseball-Reference WAR.
In earlier years, I did not bring PED use into my thought process. The use of PEDs was very widespread, not only in the 1990s and 2000's, but all the way back to the sixties and even further. It was impossible to know which players stayed clean and which used and how much it affected their performance. Eliminating or even judging players based on suspicion seemed very unfair to me. It also seemed pretty obvious that the game turned a blind eye to the problem for many decades. Thus, I considered PED use to have been part of the game and choose players solely based on their on-field performance.
Starting in 2005, Major League Baseball players and owners accepted a new policy banning steroids and issuing penalties to steroid users. The policy has been expanded in recent years to include amphetamines and other PEDs. Now that it is accepted by all parties that steroid use is absolutely prohibited, this makes the evaluation process more complicated. I think it's fair to penalize players who tested positive under the agreement starting in 2005, but I do not believe these offenders should be banned from the Hall of Fame entirely. They did, after all, already serve their time through suspension. However, the qualifications for inclusion in the Hall of Fame do include integrity, sportsmanship and character as illustrated by the following clause: Voting shall be based upon the player's record, playing ability, integrity, sportsmanship, character and contribution to the team(s) on which the player played. Those things are very subjective and near impossible to measure, but failed drug tests are objective. Thus, I shall use proven drug use as another data point feeding my decision process. Since I do not believe PED use turns a player into one of the game's all-time greats, I will still vote for an elite player such as Alex Rodriguez this year. However, I might drop a borderline player from the ballot.
The PED question first became an issue for me when first baseman Rafael Palmeiro appeared on the ballot in 2011. He was a legitimate candidate, who had tested positive in 2005. He was not a particularly strong candidate though and, given that the ballot had more than ten deserving candidates that year, it was not difficult to dismiss him.
Outfielder Manny Ramirez who tested positive for PEDs in both 2009 and 2011 has been eligible for several years. Based on his career numbers, Ramirez was one of the best hitters of his generation and would surely make it if he were clean.
However, the PED data point exists for Ramirez (twice!). Ramirez was a very one dimensional player and not a slam dunk choice of the magnitude of ARod. He is more comparable to designated hitter Edgar Martinez, who was finally inducted in 2019. I have been on the fence in regards to Ramirez for a while, but this year I'm voting for him.
Now, for my ballot:
Barry Bonds: The greatest player of his generation and on a very short list of the best players ever. You can't have a Hall of Fame without him. Roger Clemens: As with Bonds, the Hall-of-Fame does not make much sense with Clemens excluded. He is arguably one of the five best pitchers in the history of the game.
Alex Rodriguez: Similar to Bonds and Clemens, I suspect Rodriguez's links to PED use will keep him out, at least initially. However, he is one of the all-time greats and impossible to dismiss. The slugging infielder is fouth on the all-time home run list (696), seventh in total bases (5,813) and 12th in WAR (117).
Curt Schilling: Schilling is a jerk and I wish he would keep his shallow opinions to himself, but that has nothing to do with his Hall of Fame worthiness. Arguably the best post-season pitcher ever, but was a lot more than that. He had a 127 ERA+, 3,116 strikeouts (15th best ever), 81 WAR (26th best).
Scott Rolen: The Lou Whitaker of his time, had a long distinguished career, but was never regarded as a superstar. His 122 OPS+ and outstanding defense at third base helped him accumulate 70 WAR.
Todd Helton: Helton is difficult to judge because of his home park in Colorado. He Accumulated 61 WAR, and had an OPS+ of 160 or better four times. His peak years were fantastic including three years with WAR of 8.9. 8.3 and 7.8. If Scott Rolen is Lou Whitaker than Helton is Ryne Sandberg.
Manny Ramirez: As mentioned above, Ramirez's candidacy is clouded by failed PED tests, but he was an elite hitter with a 154 OPS+ and 69 WAR. He was 15th all-time in home runs (555) and 30th in total bases (4,826). His 29 post-season home runs in 111 post-season games is the most in MLB history.
Andruw Jones: Jones is difficult to evaluate because he was not an outstanding hitter like other players on the list. He did have power and hit a 434 career home runs including a league leading 51 in 2005. However he had a .339 on base percentage and his career OPS+ was just 111. On the other hand, he was widely regarded as the top defensive outfielder of his time and arguably the best of all-time. According to the Total Zone Runs statistic which uses play-by-play data and is tracked back to 1973, Jones saved 253 runs with his defense which was the second best behind only third baseman Brooks Robinson.
David Ortiz: Most writers consider Ortiz to be a slam dunk Hall of Famer. I see him as a difficult choice. Based on his regular season performance - a 141 OPS+ and 57 WAR with virtually no defensive contribution, he falls short of Hall of Fame status. His great reputation is largely based on his post-season heroics. Is that enough? I don't generally give a lot of weight to post-season performance and I have criticized writers in the past for giving pitcher Jack Morris too much credit for his 10-inning 1-0 shutout in the seventh game of the 1991 World Series. That was a great historic game, but his overall post-season record was unremarkable.
Ortiz, on the other hand, was consistently extraordinary in the post season compiling a fantastic .947 OPS in 85 games. It was not just one moment or one series. He did it year after year accumulating a career post-season Win Probability Added (WPA) of 3.16 which is the highest of any hitter in MLB history. Whereas WAR is context dependent, WPA is a situational statistic which takes the score of a game, runners on base and number outs for each plate appearance into consideration. How much weight should we give to post-season versus regular season. Tom Tango suggested in a recent tweet a weight of three for the playoffs and ten for the World Series. That seems a little excessive to me, but what if we give a weight of three for any post-season game? That is nine wins for Ortiz which added to his regular season WAR gives him 66 wins. That is high enough for the Hall of Fame.
|
|
|